Alluxo – KPI & OKR Dashboards
Create powerful KPI and OKR reports in minutes, not days. Build beautiful, shareable finance and accounting dashboards. Connect your existing business apps – like QuickBooks Online (QBO) – to bring your data to life. Get started today, no credit card required.
Our innovative business app allows users to build bar charts, line charts, area charts, and more without writing code. The data in Alluxo automatically updates, so you no longer have to manually update reports each week!
“Alluxo is a must-have for founders. I love pulling up our OKR report on my iPhone!” –Nathan
CREATE AND MANAGE OKR REPORTS
Objectives and key results (OKRs) organize team members and increase productivity. Alluxo is a great way to create OKR reports, track progress towards completing OKRs, and rallying your team around these numbers.
We handle the heavy lifting, you can focus on your OKRs and driving tangible business results. Whether you’re looking to increase revenue, user count, or another metric, Alluxo is the right solution for your business.
Alluxo is the best way to build objective and key result (OKR) reports.
BUILD AND VIEW KPI REPORTS
Need an effective way to create key performance indicator (KPI) reports for your company? Businesses use Alluxo to select and display their most important key performance indicators.
Remove the ambiguity around your company or team’s goals with an auto-updating KPI report. You can create a KPI report for each team to ensure your colleagues have the information they need to hit their monthly, quarterly, and annual goals.
Alluxo handles data management, formatting, hosting, and more – which means you get a KPI report that just works.
UPGRADE YOUR FINANCE REPORTS AND DASHBOARDS
The Alluxo pre-built connectors make data analysis simple, by enabling you to connect your apps to our powerful charting tools. Upgrade your finance reports and dashboards to include business intelligence (BI), key performance indicators (KPIs), or objectives and key results (OKR). Here are some finance report and dashboard examples:
- Create and view key performance indicators with KPI reports
- Manage objectives and key results with OKR reports
- Leverage business intelligence with published BI reports
- Automate your monthly or quarterly investor reports
- Improve communication in management and executive meetings
- Build finance reports and accounting reports that automatically update
Get all the value of advanced business analytics without the headache or overhead!
WHAT CAN I DO WITH ALLUXO?
We created Alluxo to solve a problem caused by having too many business apps, too much data, and not enough time. Instead of manually creating finance or accounting reports with spreadsheets, Alluxo enables you to connect data sources and build business dashboards in a web browser.
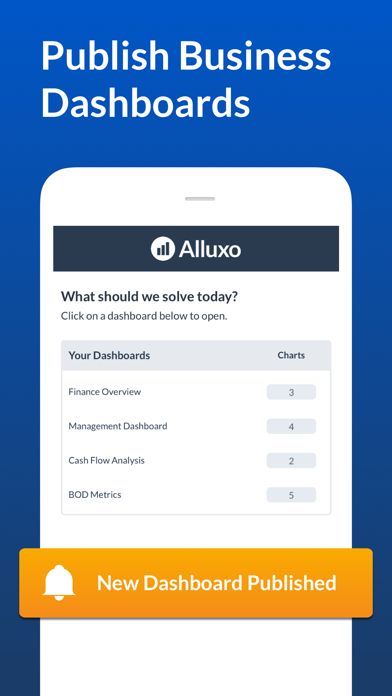
We recommend publishing your business reports so you can easily share information. Our powerful business intelligence (BI) reports can be bookmarked, emailed, pulled up in meetings, and more!
“Our team received an immediate ROI from Alluxo. We can create a new BI report in minutes!” –Tim
EXISTING INTEGRATIONS
Alluxo integrates with QuickBooks Online (QBO) and lets you build custom accounting reports and dashboards with QBO data. Create investor reports or any other report with the following data:
- Total revenue
- Gross profit
- Total expenses
- Net income
- Net operating income
- Cash balance
ACCESS YOUR DATA ANYWHERE, ANYTIME
Access your data from anywhere, at anytime, with the Alluxo iOS mobile app. We support all modern iPhone and iPad devices, which means you can view KPIs, OKRs, finance reports, accounting reports, and investor reports wherever you go.
HELPFUL CUSTOMER SUPPORT
Have questions, comments, or feature requests? Reach out to [email protected] – we’re happy to chat.


